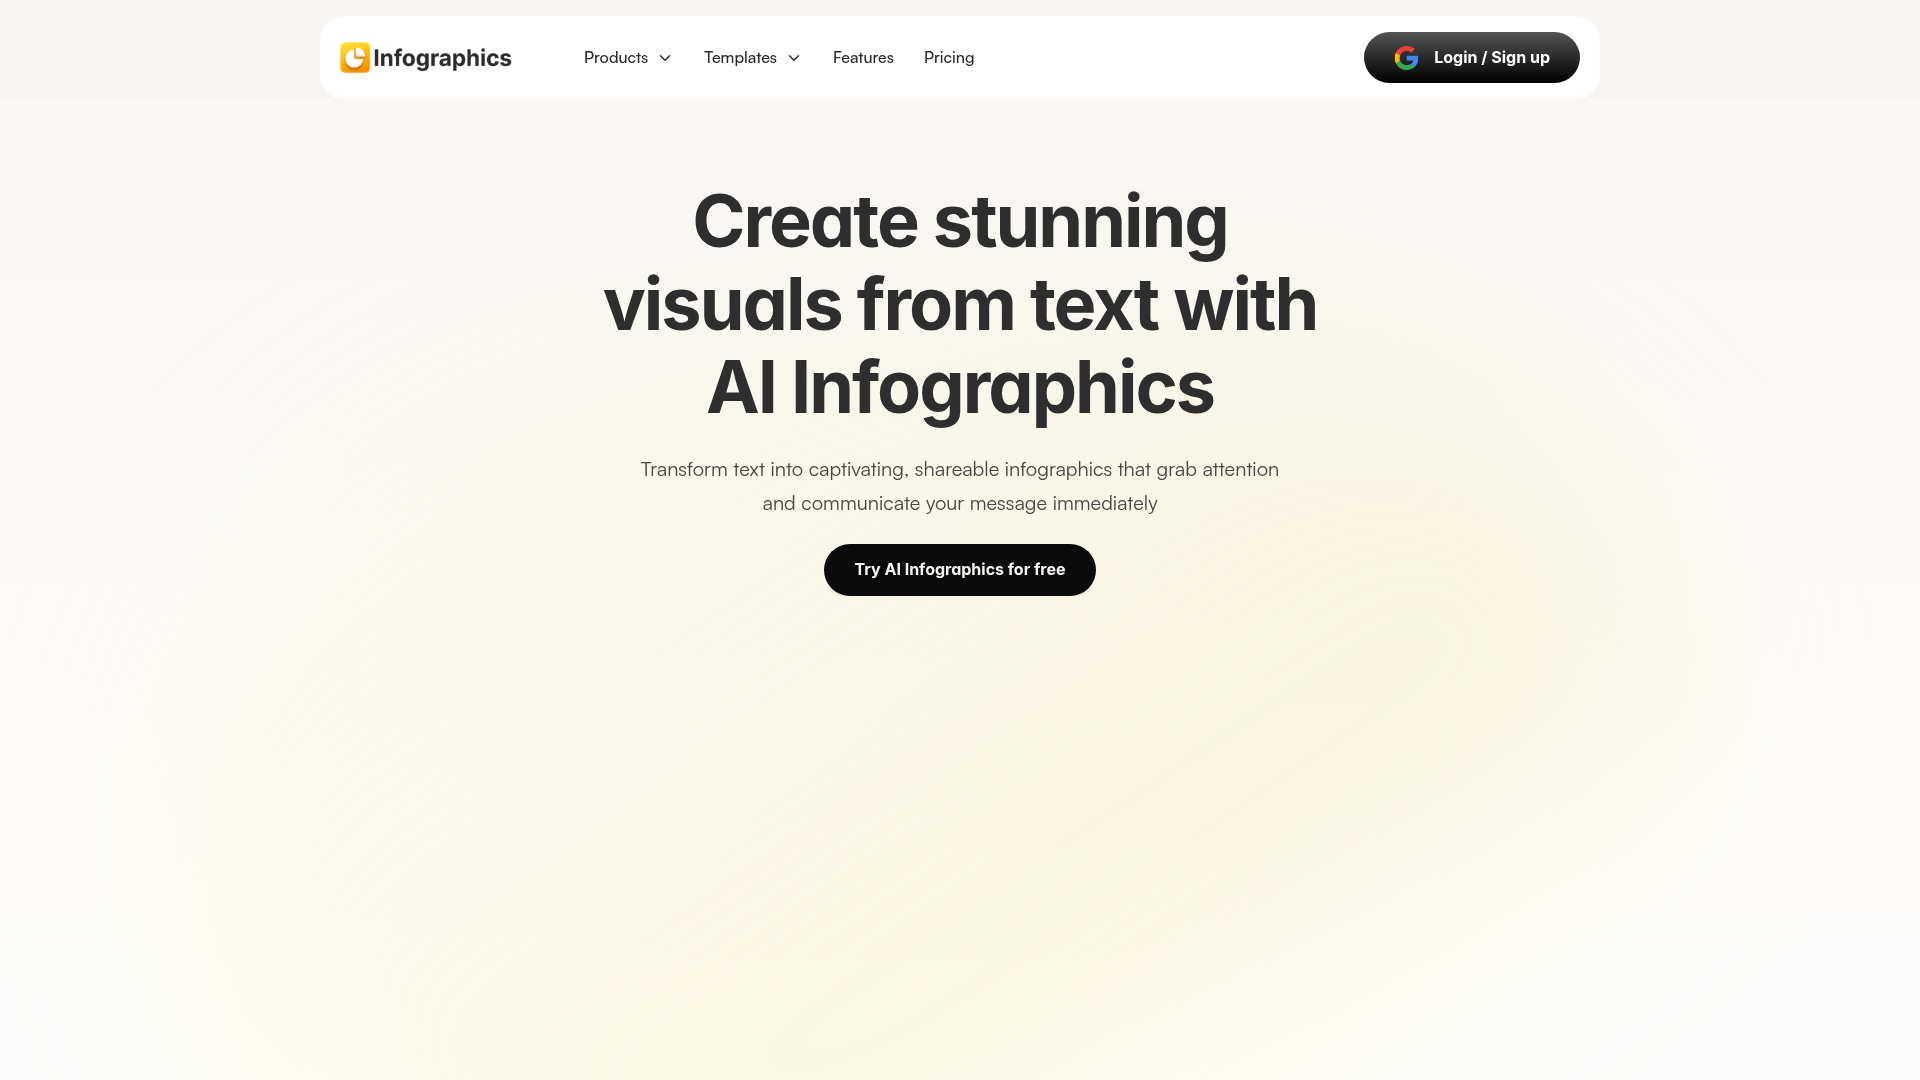
InfographicsAI - Turn text into stunning infographics
"Infographics are the Swiss Army knives of visual communication - when done right, they can cut through noise better than any other content format. But creating them? That's where most people hit a wall."
Let me paint you a picture: It's 3 PM on a Tuesday. You're staring at a blank design canvas, wrestling with data that refuses to cooperate visually. Your deadline looms like storm clouds, and the thought of manually creating another infographic makes your creative soul wither. Enter InfographicsAI - your new secret weapon for turning text into stunning visuals faster than you can say "visual storytelling."
Why Infographics Still Rule in 2025 (And Why AI Changes Everything)
We process visuals 60,000 times faster than text - that's not just a fun fact, it's biological reality. But here's the dirty little secret of content creation:
📊 65% of professionals create infographics more than any other visual media
⏳ Yet 83% waste hours on design tools they barely understand
InfographicsAI bridges this gap by combining human creativity with machine efficiency. Think of it as having a graphic designer, data analyst, and content strategist rolled into one AI-powered tool.
How InfographicsAI Works (Without the Design Headaches)
The magic happens in three stupidly simple steps:
- Paste: Dump your content - raw text, bullet points, even messy notes
- Generate: Watch AI suggest multiple professional layouts
- Customize: Tweak colors, fonts, icons to match your brand
No design degree required. No endless plugin installations. Just pure visual transformation.
The Infographic Types You Can Create in Seconds
This isn't just another "make pretty charts" tool. The range of specialized templates solves real business communication problems:
🚀 Process Visualizers
- Funnel diagrams for conversion optimization
- Cyclic processes for recurring workflows
- Step-by-step journeys for complex explanations
🏢 Organizational Tools
- Hierarchy charts that don't look like corporate nightmares
- Roadmaps that actually excite stakeholders
- Timelines that tell stories, not just list dates
🧠 Brain Boosters
- Mind maps for strategic planning sessions
- Numbered listicles that people will actually share
- Pipeline visuals that make sales data compelling
Where InfographicsAI Shines (Real-World Use Cases)
For Bloggers & Content Marketers
- Transform 2,000-word guides into scroll-stopping visual summaries
- Increase social shares by embedding infographics in posts
- Repurpose content across platforms without redesigning from scratch
For Business Teams
- Make quarterly reports actually readable (shocking concept, I know)
- Create presentation slides that don't induce coma
- Visualize customer journeys that everyone from sales to support understands
For Social Media Managers
- Stop begging the design team for last-minute assets
- Generate platform-optimized visuals in brand colors
- Test multiple visual approaches without burning hours in Canva
The Secret Sauce: AI That Understands Context
What sets InfographicsAI apart isn't just automation - it's intelligent design thinking. The AI:
- Analyzes your text to determine the most effective visual format
- Maintains logical flow while making it visually engaging
- Suggests data visualization best practices you didn't know you needed
It's like having Edward Tufte whispering design advice over your shoulder, minus the academic pretension.
Pricing That Won't Make Your CFO Blink
At $5/month (billed yearly), it's cheaper than most stock photo subscriptions. The free version covers basic needs, while premium unlocks:
✅ Unlimited generations
✅ Full brand customization
✅ Commercial usage rights
✅ Priority support
The Verdict: Should You Try It?
If you create any form of content - blogs, reports, social posts, internal docs - and want to:
- Save 3+ hours per visual
- Increase engagement without extra writing
- Look more professional without hiring designers
Then yes, emphatically yes. The real question is: can you afford NOT to try it in today's visual-first content landscape?
Pro Tip: Start with their funnel diagram templates - they're ridiculously effective for turning dry data into "aha" moments.
Create Your First AI Infographic Now (It's free - no credit card gymnastics required)
"Good design is obvious. Great design is transparent." InfographicsAI gets you to great faster than any tool I've tested this year.
Features
Funnel diagrams
Visualize customer journeys, sales conversions, and marketing funnels with ease.
Cyclic process
Show a series of steps or events that repeat without a clear end with stunning infographics.
Step-by-step journeys
Visually simplify and break down complex processes into easy-to-digest steps.
Hierarchy charts
Visualize text from smallest to biggest or most important to least important.
Roadmaps
Track projects, milestones, and improve communication and collaboration.
Timelines
Condense lifetime journey information into a simplified and visually appealing format.
Mind maps
Use for project planning, strategic thinking, and managing meetings.
Numbered listicle
Visually show actionable items in a clear and concise format.
Pipeline
Demonstrate concepts like sales pipelines, project management, or supply chain pipelines.
Traffic(2025-07)
Monthly Traffic
Traffic Source
Top Keywords
| Keyword | Traffic | Volume | CPC |
|---|---|---|---|
| create infographics with ai | 60 | 1170 | 0.60 |
| infographic ai | 40 | 7290 | 0.88 |
| ai infographic generator | 20 | 10930 | 1.92 |
| text to infographic ai free | 10 | 500 | - |
| lifetime ai infographics generator | 10 | 30 | - |
Source Region
Whois
| Domain | infographics.so |
| Creation Date | 2026-01-02 10:31:27 |
| Last Updated | 2025-03-27 09:41:54 |
| Domain Status | clienttransferprohibited, //icann.org/epp |
| Registrar | registry@namecheap.com |
| Registrar IANA ID | 1068 |
Featured Products
Related Categories
Copy embed code
Alternative Products

Neverstudio

Pocketlink

Flexpoint

ContentPilot

Charades

GoodMeetings

Bindago